A finger on the Earth's pulse
At the Geodynamic Observatory of the University of Jena, highly sensitive measuring systems collect data on the inner workings of our planet.
By Ute Schönfelder
For the last 60 years, researchers have been taking the Earth’s pulse in the Thuringian Slate Mountains. At the University of Jena’s Geodynamic Observatory, around an hour’s drive south of Jena close to the hamlet of Moxa—population 80—ultra-sensitive measurement systems collect data about our planet’s inner workings. The Earth’s »heartbeat« is sedate; these signals can generally only be filtered out of recordings spanning years or even decades. »In order to draw conclusions about the processes at work deep within the Earth, we need very long and precise data series,« says Prof. Dr Nina Kukowski, to whose Chair of Geophysics the Geodynamic Observatory is connected.
In addition to conventional instruments such as a superconducting gravimeter to register the Earth’s gravity field, Moxa observatory houses several other very sophisticated measurement systems. The University of Jena is one of only a handful of institutions around the world to operate an array of three laser strain meters, which are installed in underground tunnels and register the deformation of the Earth’s surface, sensitive to changes on the nanometre scale.
The facility’s repertoire also includes tiltmeters as well as a nearly 100 m deep borehole, which contains an optical fibre provided by the Thuringian State Office for the Environment, Mining and Nature Conservation (TLUBN) to measure the temperature of the Earth’s interior. In addition, the facility records weather data every 10 seconds. Given the combination of different sensors, the datasets generated at Moxa observatory are not only extensive but also highly heterogeneous, as Kukowski explains: »Deciphering natural signals within this data is a complex task. It would require a lot of work by a lot of people.«
In an effort to accelerate this process—and make some analyses possible in the first place— for several years, the researchers have been working with AI methods, especially machine learning. »We apply AI in two different approaches,« explains Valentin Kasburg, a doctoral candidate in Kukowski’s team. On the one hand, the researchers use AI to identify anomalies in the long-term data, such as measurement errors and natural signals, and filter them out of the time series. On the other hand, AI techniques are applied to analyse the causes of signals identified in the data and thereby gain a better understanding of the processes at work in the subsurface.
Prof. Kukowski and computer scientists Prof. Dr Alexander Breuer and Prof. Dr Martin Bücker are therefore working with their team to apply artificial neural networks (ANNs) as part of a project supported by the Carl Zeiss Foundation. These ANNs are trained with different sets of long-term geodynamic data collected at Moxa observatory. Researchers can then apply the trained models to different data series and tackle specific questions.
In an ongoing study, the team has successfully analysed data from different seismic networks and distinguished between tectonic earthquake signals and anthropogenically induced signals, such as quarry blasts.
In other studies, Valentin Kasburg explains, the team is working to identify causal relationships between different signals in the time series and distinguish them from mere correlations. »We look at weather data, precipitation events and seasonal effects in conjunction with geophysical data, trying to discover whether we can discern properties of the subsurface and how it behaves.« In this context, the team is particularly interested in groundwater. »We’re hoping to identify factors and processes influencing groundwater movements, how it is changing, e.g. as a result of climate change, and how this is mirrored in our time series,« summarizes Nina Kukowski.
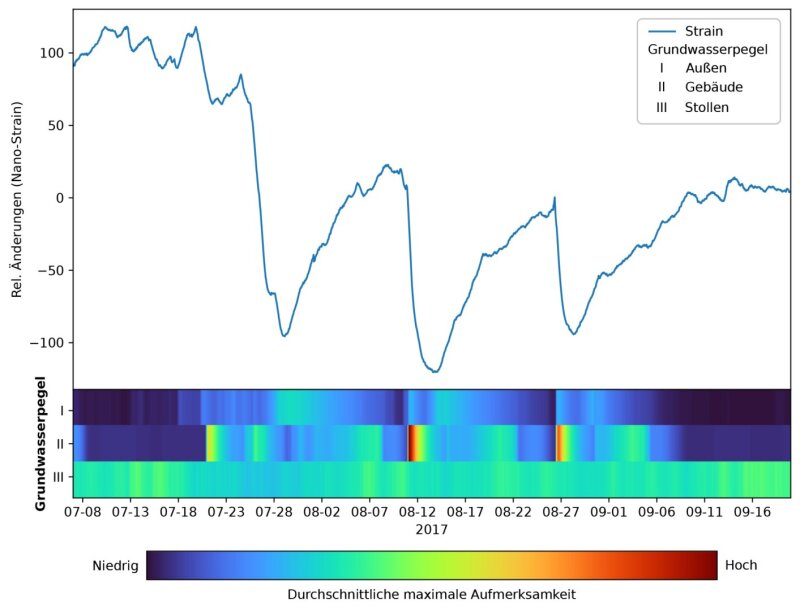
The graph in the upper part of the figure shows the change in deformation (»strain«) of the earth’s surface over the period from July to September 2017 at the site of the Geodynamic Observatory in Moxa. The lower part of the figure shows changes in the groundwater levels of three different measuring points (I-III) based on the »attention values« of the artificial neural networks used. The colour gradients indicate different contributions of the water levels to the deformation changes, from blue (low) to red (high). This allows conclusions to be drawn about the influence of groundwater levels on the movements of the earth’s crust near the surface.
Picture: Valentin Kasburg